
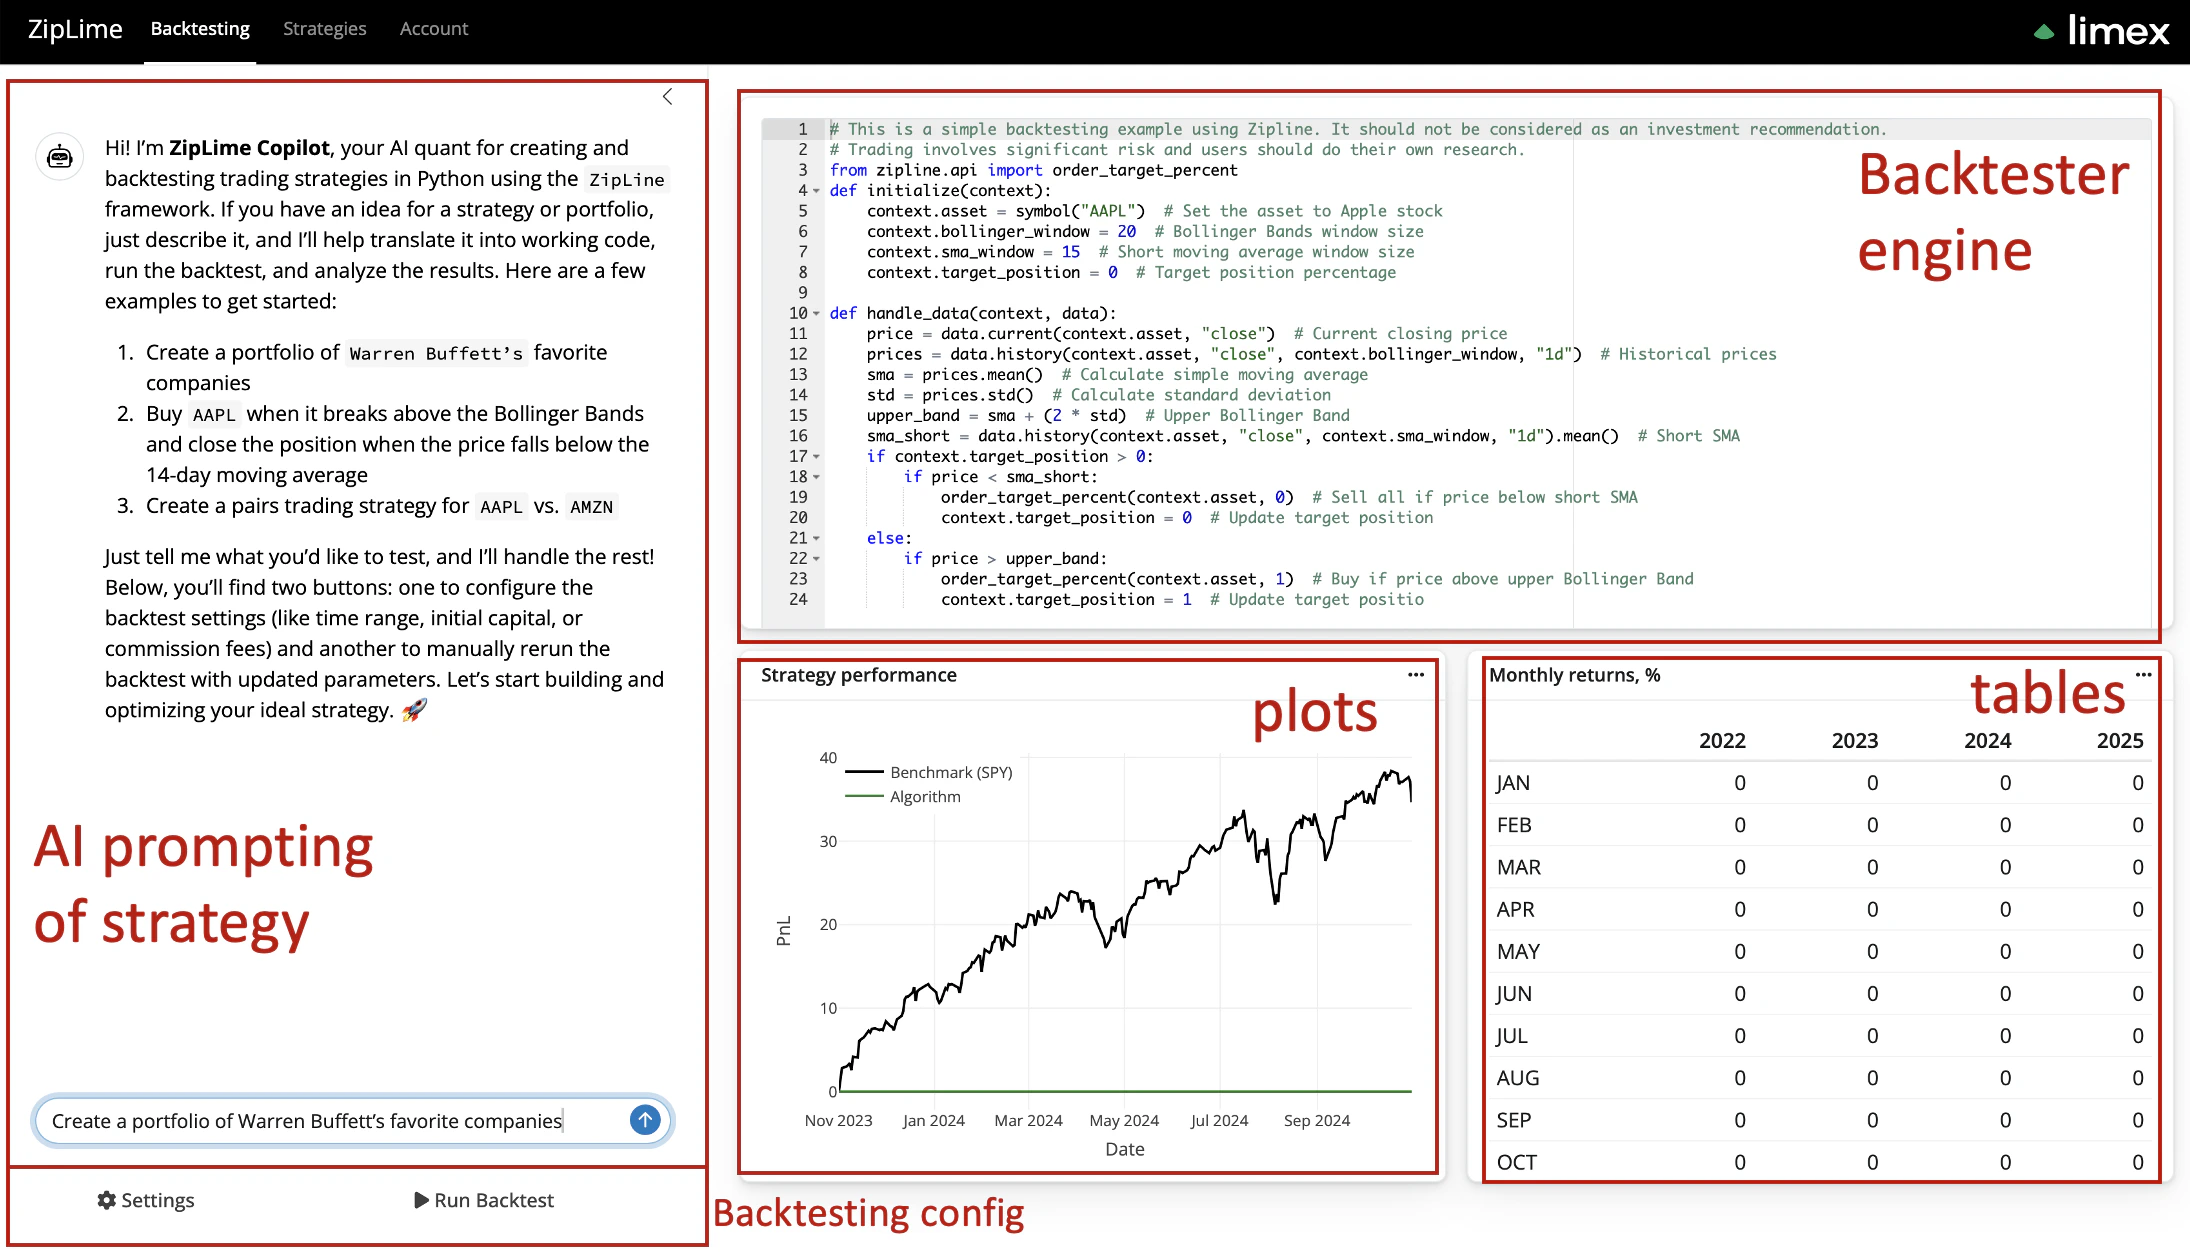
AI Prompting of Strategy
- Interactive AI Interface: The platform’s AI-powered interface allows users to input natural language descriptions of their desired trading strategies. The AI then generates the corresponding algorithmic code, offering a seamless transition from concept to execution.
Backtester Engine
- Zipline Integration: At the core of Ziplime’s backtesting capabilities is the Zipline engine. This powerful tool allows for accurate and efficient backtesting of strategies using historical data, providing users with insights into potential strategy performance.
Plots
- Data Visualization: Ziplime provides an array of plotting tools to visualize backtest results. Users can generate detailed graphs that depict various metrics, such as portfolio value, drawdowns, and risk assessments, enabling a comprehensive understanding of strategy performance.
Tables
- Basic Characteristics: In addition to plots, the platform offers tabular representations of essential strategy metrics. These tables summarize key performance indicators, making it easier to compare different strategies or assess the impact of modifications.
Backtesting Config
- Configurable Backtesting Environment: The backtesting configuration interface allows users to manage and manually initiate backtests. Users can set parameters such as time range, data frequency, and dataset selection, offering full control over the backtesting process.